
Default reports in Klocwork Static Code Analysis
Default reports in Klocwork Static Code AnalysisThis article provides reference information on the default reports in Klocwork Static Code Analysis. For how-to information on creating and editing reports, see Getting started with reports in Klocwork Static Code Analysis. Note: Your reports tree may also contain migrated reports if you upgraded from a previous version.
SummaryThe Summary report is your project dashboard, providing quick diagnostic information about the health of your project. The Summary report provides four default reports:
Click any report to see a more detailed and editable view. You can edit this report to add other default reports or reports that you have created. Similar to other reports, you can enable or disable whether issues are grouped for the Summary report's issue count header (you'll need to make a copy of this report to change this setting, as default reports cannot be edited). The grouping setting for the reports placed on the dashboard is determined from each report's grouping setting, if applicable. Editing this setting for the Summary report affects the number of issues displayed at the top of the report, as seen here:
Issue Summary
Category DetailsThe Category Details report shows how detected issues are distributed across taxonomies and categories. For each taxonomy (and category in that taxonomy, if applicable), you see:
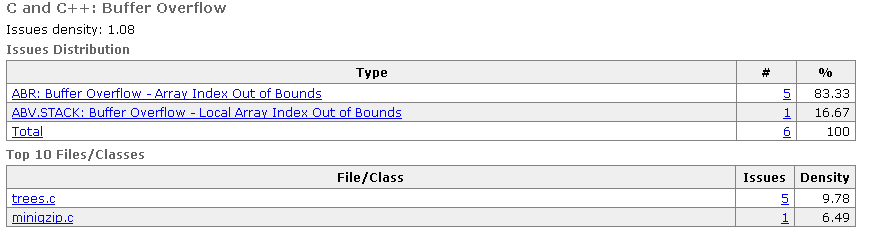
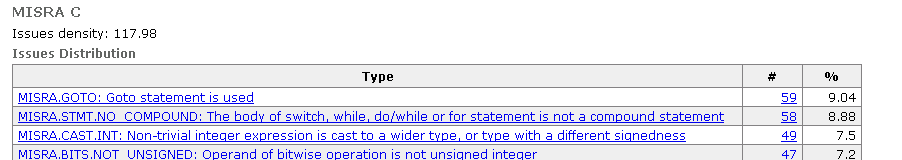
Taxonomies that contain categories show the issue distribution and Top 10 files/classes by category. In this case, you see the <taxonomy_name>:<category_name> heading. The example below shows tables for detected issues in the Buffer Overflow category for the C/C++ taxonomy: Some taxonomies may not contain categories. In this case, you see the distribution and Top 10 by taxonomy (MISRA C, for example). Organizations can set up customized categories to reflect their own processes. See Configuring checkers for the integration build analysis. From Category Details you can:
Citing Activity Since Last BuildCiting Activity displays changes in issue status since the last build. Note: Issue grouping is disabled for this report type.
The Citing Activity report shows:
Note: You only see a Backlog report by owner if owners are loaded into the Klocwork database. If ownership is not set up, uncited issues are labeled "unowned". For information about how to set up ownership, see Tracking issues by owner.
Citing BacklogThe Citing Backlog report shows two trends per day:
Note: Issue grouping is disabled for this report type.
If you choose to see this report over a number of builds, then the backlog trends are shown from the day of the first build date to the day of the last build. Selecting the "last <n> builds" shows the date of each build up until the current date. The table below the chart shows the Analyze and Fix backlog by owner. The issues shown on this graph are in any state but Fixed. See Issue states.
Fix Activity by ModuleThe default Fix Activity report summarizes defect fixes by module for the integration project. You can edit this report to show what defects your developers have prevented from entering the code stream. Note: This report may be called Fix Activity by Component if you have migrated from a previous version.
When more than one build is selected or a time frame is selected that contains more than one build, bars in the graph show build pairs. For example, if three builds are selected, then two bars would be shown: one showing the number of fixed issues between build_1 and build_2, and a second showing the number of fixed issues between build_2 and build_3. If only one build is selected, this report shows fixes since the previous build. Fix Activity reports can be summarized by:
By default, Fix Activity Summarized by Owner displays desktop fixes for the last 10 builds on the Project Summary page. Fix Activity reports show a count of:
When an issue shows up in the desktop component but not in the integration build, it means that the desktop issue was detected and fixed while the developer was coding (before submitting code to the integration build). Desktop fixes are preventative fixes because the problems were fixed before check-in. Viewing Fix Activity by desktop indicates who has been using Klocwork on the desktop. Note: Desktop fixes from the Visual Studio plug-in do not show in this report.
Top 10 Open IssuesThe default pie graph shows you how the top 10 detected issues are distributed in the latest build by issue type. You can customize the number of issues on the fly. Clicking on a segment displays the issue list for the selected issue type. Issue TrendIssue Trend reports provide a high-level view of code issues over multiple builds. You can adjust the timeline to target one or more specific builds. The Y-axis displays number of issues. Trending provides an overall view of product quality and fix rates that allows you to gauge the effectiveness of your organization's strategy, policies (for example, staff training) or compliance with industry standards such as MISRA C or MISRA C++. There are three types of Issue Trend reports by default: Open Issues by Module, Open Issues by Owner and Rejected Issues by Owner. Open Issues (by Module or Owner) reports show the distribution of issues by their current status in the build(s) you select. The Rejected Issues by Owner report shows the issues that have been rejected in the build(s) you select. A rejected issue is an issue that has been set to status of 'Ignore' or 'Not a problem'. Tip: The build(s) represented in the report are customizable by clicking-and-dragging over a section of the report timeline at the bottom of the report. Metrics
Complexity TrendDisplays the number of functions or class-methods that exceed the specified cyclomatic complexity threshold. The default cyclomatic complexity threshold for the report is 20. For information about thresholds, see System Complexity.
Complexity DetailsShows you the number of instances of the top 15 complex methods and a list of modules that exceed the specified complexity threshold. Whereas the Complexity report provides trending information, Complexity Details provides further information about the latest build such as the number of methods with complexity greater than the threshold for each module. Information displayed depends on the module you select.
Size TrendTallies the total lines of code for the project or selected module. About the Projects pageAfter you log in to Klocwork Static Code Analysis, you see the Projects page. From this page, you can navigate to:
If you have the project manager/administrator role, you can:
|